
Cincinnati site model and feasibility data
Elevation, aerial imagery, building footprints, roads and more for downtown Cincinnati, around Fountain Square and the Ohio River basin, in files you keep.
Mantle Place builds a site model of Cincinnati: elevation, aerial imagery, buildings and more, in one georeferenced bundle. The pre-drawn area covers downtown Cincinnati: 1,192 acres, with public parcel records in reach.
What a bundle carries here
- Area
- 1,192 acres (4.8 km²). Downtown Cincinnati, around Fountain Square, with Over-the-Rhine on the north side and the Ohio River basin on the south.
- Price
- $15 for the pre-drawn area, once. Keep the files.
- Elevation
- USGS 3DEP 1 m (1 m here), then 3DEP 1/9″ (3.43 m here), then 3DEP 1/3″ (10.28 m here). Mapterhorn (30 m) backs it.
- Imagery
- NAIP aerial photography where it covers the site, otherwise Copernicus Sentinel-2, in the bundle.
- Buildings and roads
- Building footprints and the road network ship for the area.
- Flood map
- FEMA flood zones ship for the area.
- Parcels
- Campbell County, from Campbell County PVA (Property Valuation Administrator, via LINK-GIS, Planning and Development Services of Kenton County); Kenton County, from Kenton County PVA (Property Valuation Administrator, via LINK-GIS, Planning and Development Services of Kenton County); Statewide, from OGRIP (Ohio Geographically Referenced Information Program), Statewide Parcels, from the county auditors’ data
- Zoning
- No public zoning source covers this area yet.
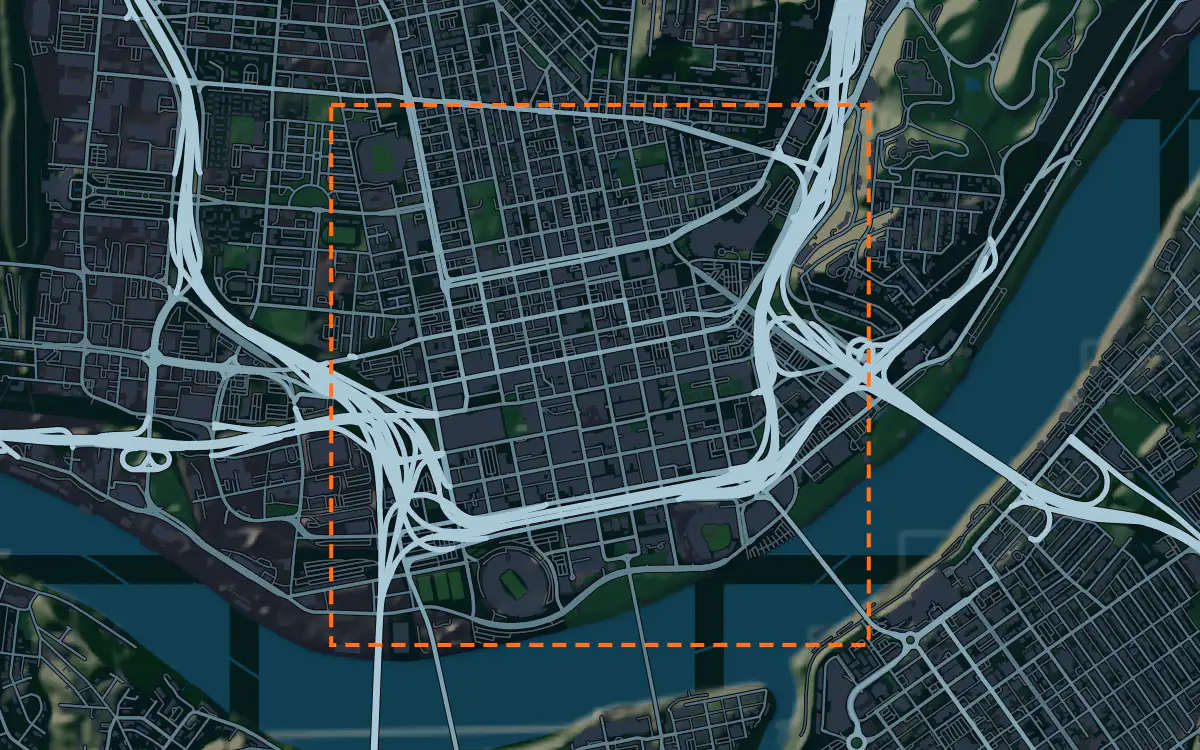
A site model
Cincinnati is a basin ringed by hills. Downtown sits on the flat terrace beside the Ohio River, and the hillsides climb steeply behind it, so a terrain model of the extent shows a city whose neighborhoods are separated by slope. That relief is the first thing a designer reads here.
The context is dense: a tower core, the old brick blocks of Over-the-Rhine, the stadiums by the river and the suspension bridge that spans the water. Extruded footprints give a presentation model the scale of the basin, and the imagery draws the river, the bridge and the dense canopy on the hillsides. Designers take the downtown Cincinnati bundle into Unreal, Revit, AutoCAD, and more.
A feasibility kit
Slope is the Cincinnati feasibility question. Hillside lots can be steep, and the contours from the bundle show it before a grading consultant is hired. The figures above list the public parcel and zoning layers that reach this ground, and the bundle sets each beside the terrain so a developer reads the lot and its fall together.
The river brings flood risk to the basin floor and the hillsides bring slope-stability risk, which is a matter for a geotechnical consultant.
Next: topography and contours for a large tract and a Civil 3D surface from lidar.
Public data for concept grading. Confirm boundaries and grades with a site survey.
Frequently asked
Can I model the hillside neighborhoods around the basin?
Yes. Draw an area over a hillside and the bundle carries the steep terrain with the imagery and footprints for that boundary.
Can I model across the river in Covington or Newport?
Yes. Draw your own area across the Ohio River and the bundle is built for that boundary, within the order maximum.
Keep the data for Cincinnati.
Open the pre-drawn 1,192 acres in the curator, move or resize it, and download a bundle you keep.
Native plugins: Mantle Place for Unreal, Mantle Place for Revit, and Mantle Place for AutoCAD.
Open this area in the curator