
Indianapolis site model and feasibility data
Elevation, aerial imagery, building footprints, roads and more for downtown Indianapolis, around Monument Circle, in files you keep.
Mantle Place builds a site model of Indianapolis: elevation, aerial imagery, buildings and more, in one georeferenced bundle. The pre-drawn area covers downtown Indianapolis: 1,200 acres, with public parcel and zoning records in reach.
What a bundle carries here
- Area
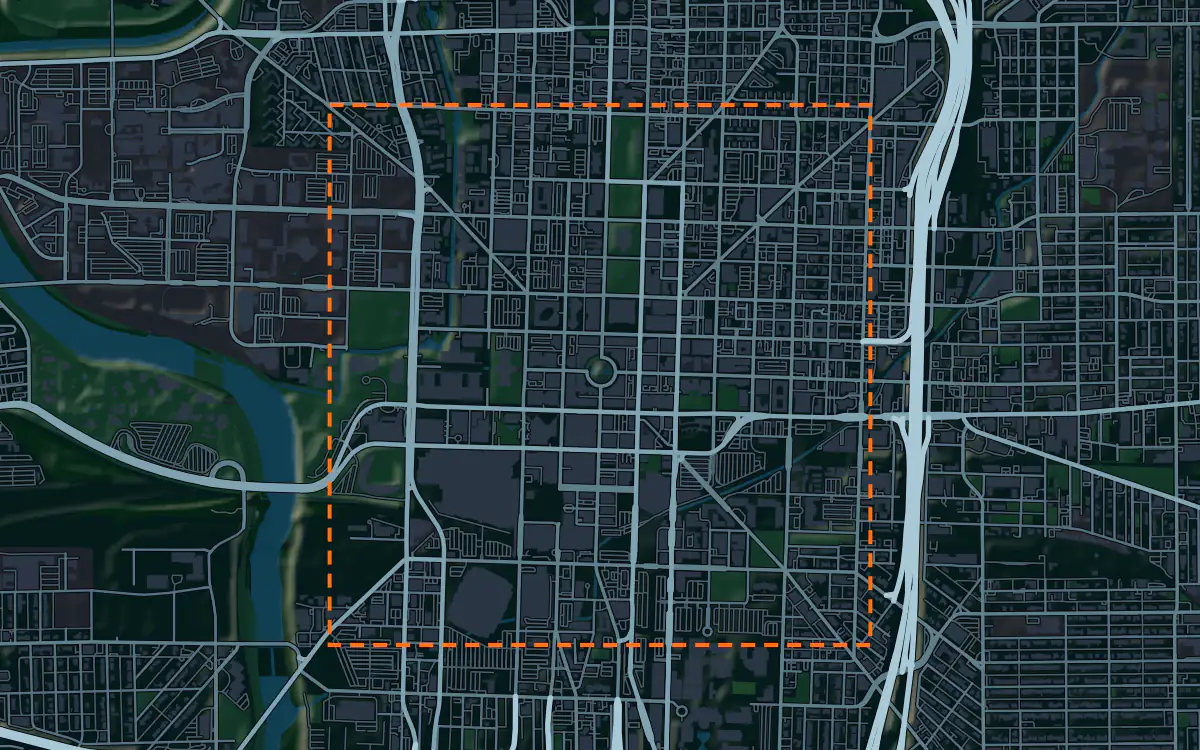
- 1,200 acres (4.9 km²). Downtown Indianapolis, centered on Monument Circle and the diagonal avenues that radiate from it.
- Price
- $15 for the pre-drawn area, once. Keep the files.
- Elevation
- USGS 3DEP 1 m (1 m here), then 3DEP 1/9″ (3.43 m here), then 3DEP 1/3″ (10.28 m here). Mapterhorn (30 m) backs it.
- Imagery
- NAIP aerial photography where it covers the site, otherwise Copernicus Sentinel-2, in the bundle.
- Buildings and roads
- Building footprints and the road network ship for the area.
- Flood map
- FEMA flood zones ship for the area.
- Parcels
- Statewide, from Indiana Geographic Information Office (IGIO), IndianaMap (Indiana GIS Data Harvest, from the counties’ data)
- Zoning
- Indianapolis and Marion County, from City of Indianapolis and Marion County, Indiana
A site model
Indianapolis was laid out around a circle with four diagonal avenues, and the plan survives in the street pattern. The land is close to level, with a slight fall toward the White River, and a terrain model of the extent shows how little the ground does to organize the city and how much the plan does.
The Circle and its monument are the formal center of the context, with the stadiums and the cultural district nearby. Extruded footprints give a presentation model the scale of the core, and the imagery shows the canal and the park edge that the city has built downtown. A camera on the Circle shows the avenues running away. Designers take the downtown Indianapolis bundle into Unreal, Revit, AutoCAD, and more.
A feasibility kit
Level ground makes feasibility a question of the lot more than the slope, so the figures above list which public parcel and zoning layers reach this area, and the bundle sets each beside the terrain. A developer can then read the district, the lot lines and the drainage in one drawing.
The river and its creeks carry the flood questions, and flat ground drains slowly, so the contours matter more than they seem to. Read the public flood map, where it reaches the site, with them.
Next: topography and contours for a large tract and a Civil 3D surface from lidar.
Public data for concept grading. Confirm boundaries and grades with a site survey.
Frequently asked
Can I model a site in Carmel or Fishers?
Yes. Draw your own area over any suburb and the bundle is built for that boundary, with the same terrain, imagery, buildings, roads and more.
Which public records reach downtown Indianapolis?
Public parcel and zoning records reach downtown Indianapolis, clipped to its edge; the figures above name the sources.
Keep the data for Indianapolis.
Open the pre-drawn 1,200 acres in the curator, move or resize it, and download a bundle you keep.
Native plugins: Mantle Place for Unreal, Mantle Place for Revit, and Mantle Place for AutoCAD.
Open this area in the curator