
Lancaster County site model and feasibility data
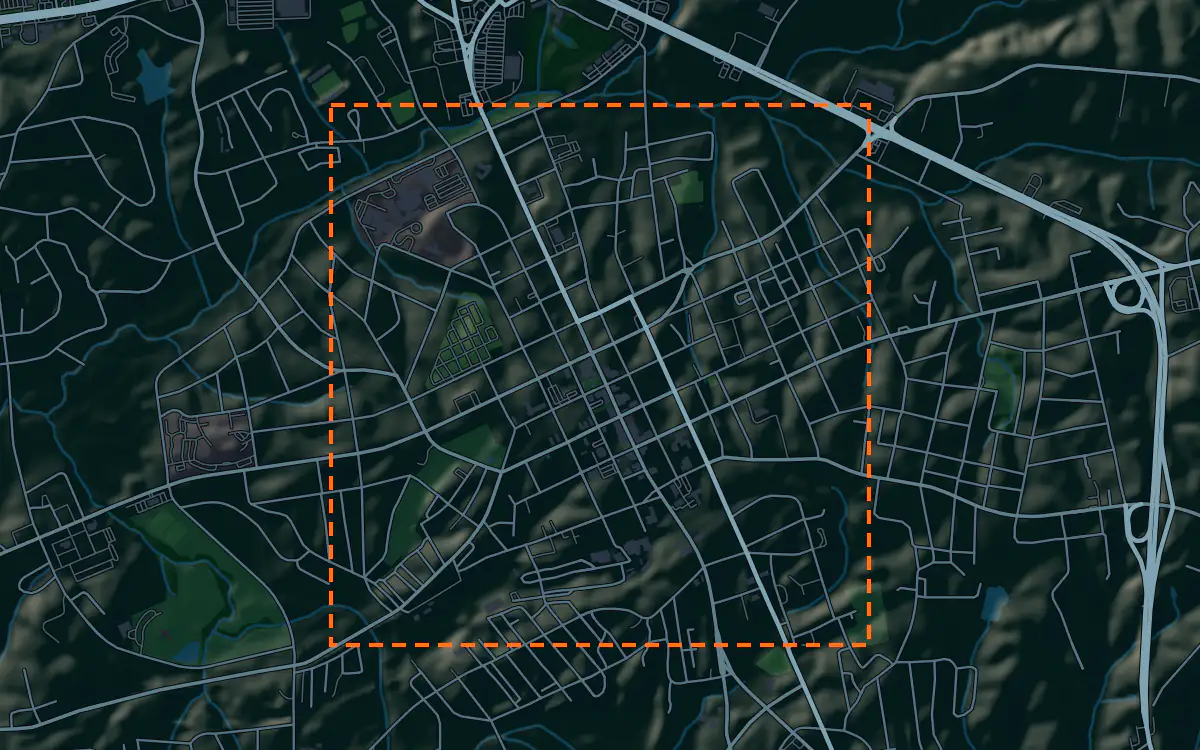
Elevation, aerial imagery, building footprints, roads and more anywhere in Lancaster County, opened here on downtown Lancaster.
Mantle Place builds a site model of Lancaster County: elevation, aerial imagery, buildings and more, in one georeferenced bundle. The pre-drawn Lancaster County area covers downtown Lancaster: 1,193 acres, with public parcel records in reach.
What a bundle carries here
- Area
- 1,193 acres (4.8 km²). Downtown Lancaster, the county seat, around the courthouse and the blocks of older brick buildings of the town center.
- Price
- $15 for the pre-drawn area, once. Keep the files.
- Elevation
- USGS 3DEP 1 m (1 m here), then 3DEP 1/9″ (3.42 m here), then 3DEP 1/3″ (10.27 m here). Mapterhorn (30 m) backs it.
- Imagery
- NAIP aerial photography where it covers the site, otherwise Copernicus Sentinel-2, in the bundle.
- Buildings and roads
- Building footprints and the road network ship for the area.
- Flood map
- FEMA flood zones ship for the area.
- Parcels
- Lancaster County, from Lancaster County, South Carolina (GIS)
- Zoning
- No public zoning source covers this area yet.
A site model
Lancaster County runs from the Charlotte suburbs on its northern tip down through rolling Piedmont country toward the Catawba River. Downtown Lancaster sits on gently rolling ground, and a terrain model of the extent shows the swells and the small creeks that cut the older town.
The context is a county-seat town with a courthouse, a historic main street and old oaks, with subdivisions spreading from the north. Extruded footprints let a designer test a proposal against that scale, and the imagery draws the square and the woods and fields beyond. Designers take the downtown Lancaster bundle into Unreal, Revit, AutoCAD, and more.
A feasibility kit
Charlotte’s growth has crossed the state line into Lancaster County, and wooded tracts and farms near it are turning into subdivisions.
Creeks and stream buffers can take a share of a rolling tract out of play, and the low ground beside them is often mapped for flood. The contours and the public flood map, where it reaches the site, show where the buildable land is. Confirm everything with a survey.
Next: topography and contours for a large tract and a Civil 3D surface from lidar.
Public data for concept grading. Confirm boundaries and grades with a site survey.
Frequently asked
Can I model the Indian Land area near Charlotte?
Yes. Draw an area over the northern part of the county and the bundle carries the terrain, imagery, roads and more for that boundary.
How do I see stream buffers on a Lancaster County tract?
Read the public flood map and the contours in the bundle against the tract to see the low ground along its creeks. The buffer widths come from the local rules, so confirm them.
Keep the data for Lancaster County.
Open the pre-drawn 1,193 acres in the curator, move or resize it, and download a bundle you keep.
Native plugins: Mantle Place for Unreal, Mantle Place for Revit, and Mantle Place for AutoCAD.
Open this area in the curator