
Louisville site model and feasibility data
Elevation, aerial imagery, building footprints, roads and more for downtown Louisville, from the Ohio River waterfront inland, in files you keep.
Mantle Place builds a site model of Louisville: elevation, aerial imagery, buildings and more, in one georeferenced bundle. The pre-drawn area covers downtown Louisville: 1,197 acres, with public parcel and zoning records in reach.
What a bundle carries here
- Area
- 1,197 acres (4.8 km²). Downtown Louisville, from the western part of the Ohio River waterfront park south through the core of the central business district.
- Price
- $15 for the pre-drawn area, once. Keep the files.
- Elevation
- USGS 3DEP 1 m (1 m here), then 3DEP 1/9″ (3.43 m here), then 3DEP 1/3″ (10.28 m here). Mapterhorn (30 m) backs it.
- Imagery
- NAIP aerial photography where it covers the site, otherwise Copernicus Sentinel-2, in the bundle.
- Buildings and roads
- Building footprints and the road network ship for the area.
- Flood map
- FEMA flood zones ship for the area.
- Parcels
- Statewide, from Indiana Geographic Information Office (IGIO), IndianaMap (Indiana GIS Data Harvest, from the counties’ data)
- Zoning
- Louisville-Jefferson County, from Louisville Metro Planning & Design (served by LOJIC, the Louisville/Jefferson County Information Consortium)
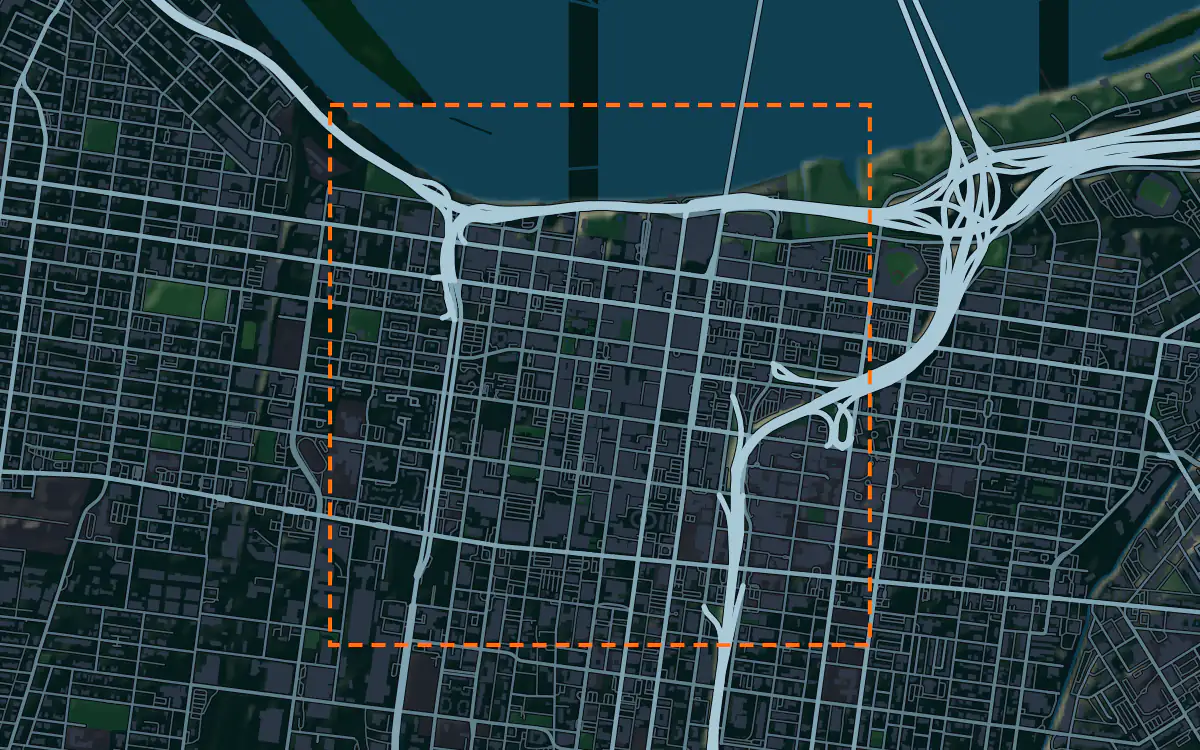
A site model
Louisville sits on the broad floodplain of the Ohio River, and downtown is nearly level, with the waterfront as its one big edge. A terrain model of the extent shows how the ground rises from the river and where the park built along the water sits relative to the streets.
The context mixes a historic cast-iron district, newer towers and the bridges that carry the city across the river. Extruded footprints let a team test a proposal against that mix, and the imagery draws the waterfront park, the river and the freeway that runs along the downtown edge. Designers take the downtown Louisville bundle into Unreal, Revit, AutoCAD, and more.
A feasibility kit
A river city lives with its floodplain, and Louisville has long protected downtown with levees and a floodwall. The public flood map, where it reaches the site, shows the mapped zones, and the contours from the bundle show how high a lot stands. Together they are the first look at what part of a tract is buildable.
A developer can read the lot, its district and the grade in one drawing. It is public data for screening; confirm boundaries and grades with a survey before you close.
Next: topography and contours for a large tract and a Civil 3D surface from lidar.
Public data for concept grading. Confirm boundaries and grades with a site survey.
Frequently asked
Can I model the waterfront park and the bridges?
Yes. Draw an area over the waterfront and the bundle carries the terrain, imagery, footprints, roads and more for that boundary.
Which public records reach downtown Louisville?
Public parcel and zoning records reach downtown Louisville, clipped to its edge; the figures above name the sources.
Keep the data for Louisville.
Open the pre-drawn 1,197 acres in the curator, move or resize it, and download a bundle you keep.
Native plugins: Mantle Place for Unreal, Mantle Place for Revit, and Mantle Place for AutoCAD.
Open this area in the curator