
Miami site model and feasibility data
Elevation, aerial imagery, building footprints, roads and more for downtown Miami and the north end of Brickell, from Biscayne Bay to the Miami River, in files you keep.
Mantle Place builds a site model of Miami: elevation, aerial imagery, buildings and more, in one georeferenced bundle. The pre-drawn area covers downtown Miami and the north end of Brickell: 1,198 acres, with public parcel and zoning records in reach.
What a bundle carries here
- Area
- 1,198 acres (4.9 km²). Downtown Miami and the north end of Brickell, between Biscayne Bay and the Miami River, with the bridges that carry the street grid across the water.
- Price
- $15 for the pre-drawn area, once. Keep the files.
- Elevation
- USGS 3DEP 1 m (1 m here), then 3DEP 1/9″ (3.42 m here), then 3DEP 1/3″ (10.26 m here). Mapterhorn (30 m) backs it.
- Imagery
- NAIP aerial photography where it covers the site, otherwise Copernicus Sentinel-2, in the bundle.
- Buildings and roads
- Building footprints and the road network ship for the area.
- Flood map
- FEMA flood zones ship for the area.
- Parcels
- Statewide, from Florida Department of Revenue, Property Tax Oversight (statewide parcel map, from the 67 county property appraisers)
- Zoning
- Unincorporated Miami-Dade County, from Miami-Dade County (GIS Technical Support Group)
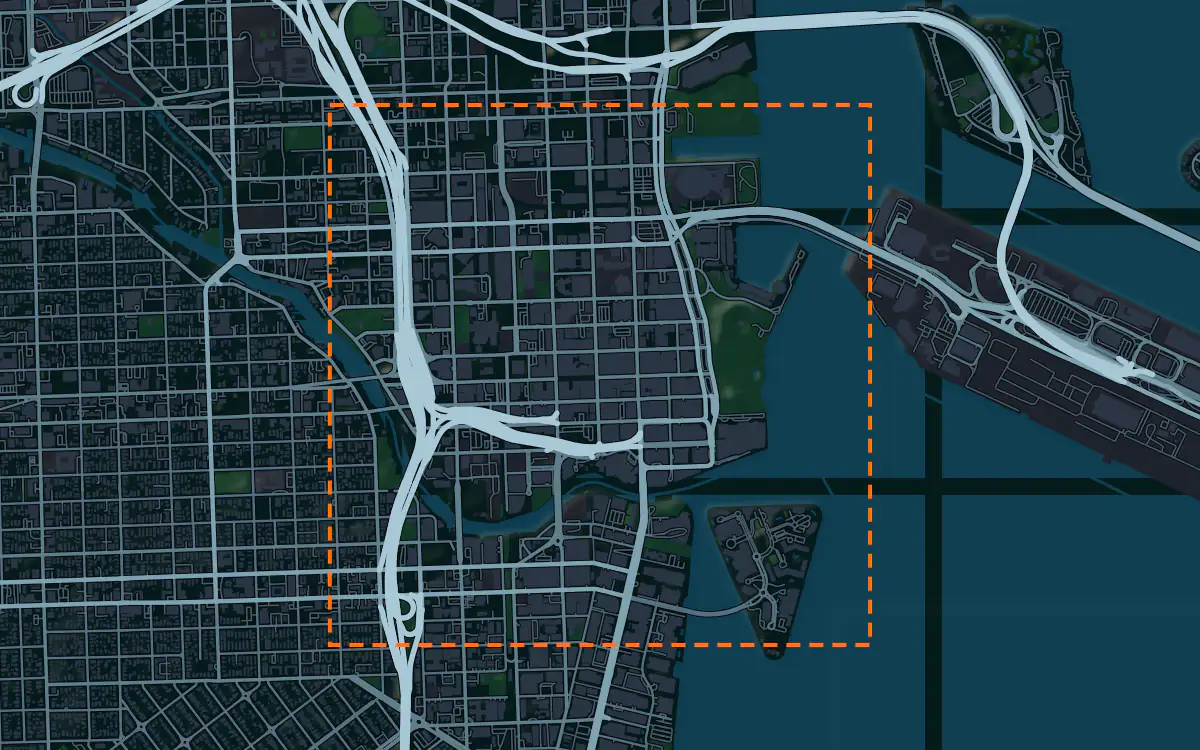
A site model
Miami is defined by how little relief it has. The ground barely rises from Biscayne Bay, so a few inches of ground height can decide how a lobby meets the street. A terrain model of the extent shows those subtle rises, and the crossings of the Miami River, where the grid breaks around the water.
Context here is a wall of towers facing the bay. Extruded footprints let a designer test a new massing against the skyline and the water, and the imagery shows the marinas, the bridges, and the park that opens the downtown to the shore. A presentation model with the bay in it needs the shoreline to be right. Designers take the downtown Miami and the north end of Brickell bundle into Unreal, Revit, AutoCAD, and more.
A feasibility kit
Waterfront development in Miami starts with elevation. The figures above show which rung of the national elevation ladder serves this latitude, and the contours cut from it show how high a site stands above the tide before anyone drafts a podium or a garage level. That is a screening view, not a survey.
Flood exposure is the question every Miami tract meets early. Lay the public flood map, where it reaches the site, over the contours with the parcels beside them, and you can see how much of a lot is mapped before a civil engineer is on the clock. Confirm zones and grades with a licensed survey before you close.
Next: topography and contours for a large tract and a Civil 3D surface from lidar.
Public data for concept grading. Confirm boundaries and grades with a site survey.
Frequently asked
Can I see how high a Miami waterfront site sits above the bay?
Yes. The elevation in the bundle is the finest native source for the area, and you can pull contours from it to read the height of a lot above the water. Confirm with a survey before you design to it.
Can I model Miami Beach or Coral Gables instead of downtown?
Yes. Draw your own area over any part of the metro and the bundle is built for that boundary.
Keep the data for Miami.
Open the pre-drawn 1,198 acres in the curator, move or resize it, and download a bundle you keep.
Native plugins: Mantle Place for Unreal, Mantle Place for Revit, and Mantle Place for AutoCAD.
Open this area in the curator